Distributors Lose Margin to Inventory Leakage They Cannot See. Signal-Oi is building the platform to stop it.
Manufacturers Can See What They Shipped — Not What Actually Sold. Signal-Oi Reveals Real Sell-Through After the Depot Gate.
Importers Learn the Real Landed Cost Only After the Money Is Gone. Signal-Oi Reconciles the Consignment While It Still Matters.
The Operational Intelligence Layer for Trade & Distribution.
The operational intelligence layer that connects your ERP, CCTV, gate logs, and GPS into a single source of physical truth — so you can see, flag, and recover losses before they become month-end write-offs. No new infrastructure required.
Your ERP records every primary dispatch. Your CRM captures every trade agreement. But once goods cross the distributor’s depot gate, visibility ceases. Signal-Oi sits above your existing systems — turning the unmeasured majority of your channel from invisible to structured. No new infrastructure required.
Purchase order, packing list, bill of lading, clearing agent invoice, duty payment, warehouse GRN — six records of one consignment, none of which agree. Signal-Oi fuses them into a single landed-cost timeline per shipment and per SKU, so variance surfaces while you can still act on it.
Signal-Oi serves three segments of the trade and distribution chain. Select yours below to see how it applies to your business.
2–5%
Net distributor margins — Nigerian FMCG benchmark
4–5%
Shrinkage in unautomated distribution hubs
20%+
of inventory discrepancies caused by administrative error alone
70%
of sales moving through channels with no digital audit trail — traditional-trade markets
15–20%
of gross revenue at risk from trade promotion leakage
2–4wk
secondary sales reporting lag on stale distributor data
6
separate records describe one consignment — none reconcile automatically
2–6wk
typical lag before the true landed cost of a shipment is known
Consignment
the level most importers cost at — leaving per-SKU margin unknown
The Operational Reality
Your data is fragmented — not missing.
You move enormous value in goods every week, but a complete picture only surfaces at month-end. On the thin net margins typical of distribution — low single digits — a 4–5% shrinkage rate in unautomated warehouses doesn’t compress margin. It cannibalises the entire operating profit.
Administrative errors drive over 20% of inventory discrepancies, and the delay in detection amplifies every loss. The data to stop this already exists — it has never been connected.
01
Cameras record but are never reviewed
No systemic trigger links an invoice timestamp to a loading bay event. Video evidence exists — but is never correlated to a financial discrepancy.
02
ERPs log what staff enter, not what happened
When trucks are dispatched, the ERP registers the full quantity. If staff divert stock, there is no mechanism to cross-check against physical reality.
03
GPS tracks vehicles but not inventory
Route deviation and delivery confirmation sit disconnected from stock counts and GRN records, creating a gap between movement and ledger.
04
Month-end reconciliation finds loss too late
By the time a 5% variance surfaces on a spreadsheet, the physical goods — and the capital they represent — are permanently lost.
Signal-Oi for Distributors
The intelligence layer above your existing systems.
Signal-Oi is not a new ERP, WMS, or tracking app. We plug into the systems you already use — your ERP, CCTV, gate logs, stock cards, and invoices — and fuse them into a single operational timeline.
When an order is received, stored, picked, or dispatched, Signal-Oi automatically cross-checks the physical reality against your ledger — flagging shrinkage and dispatch mismatches in real time, with evidence attached.
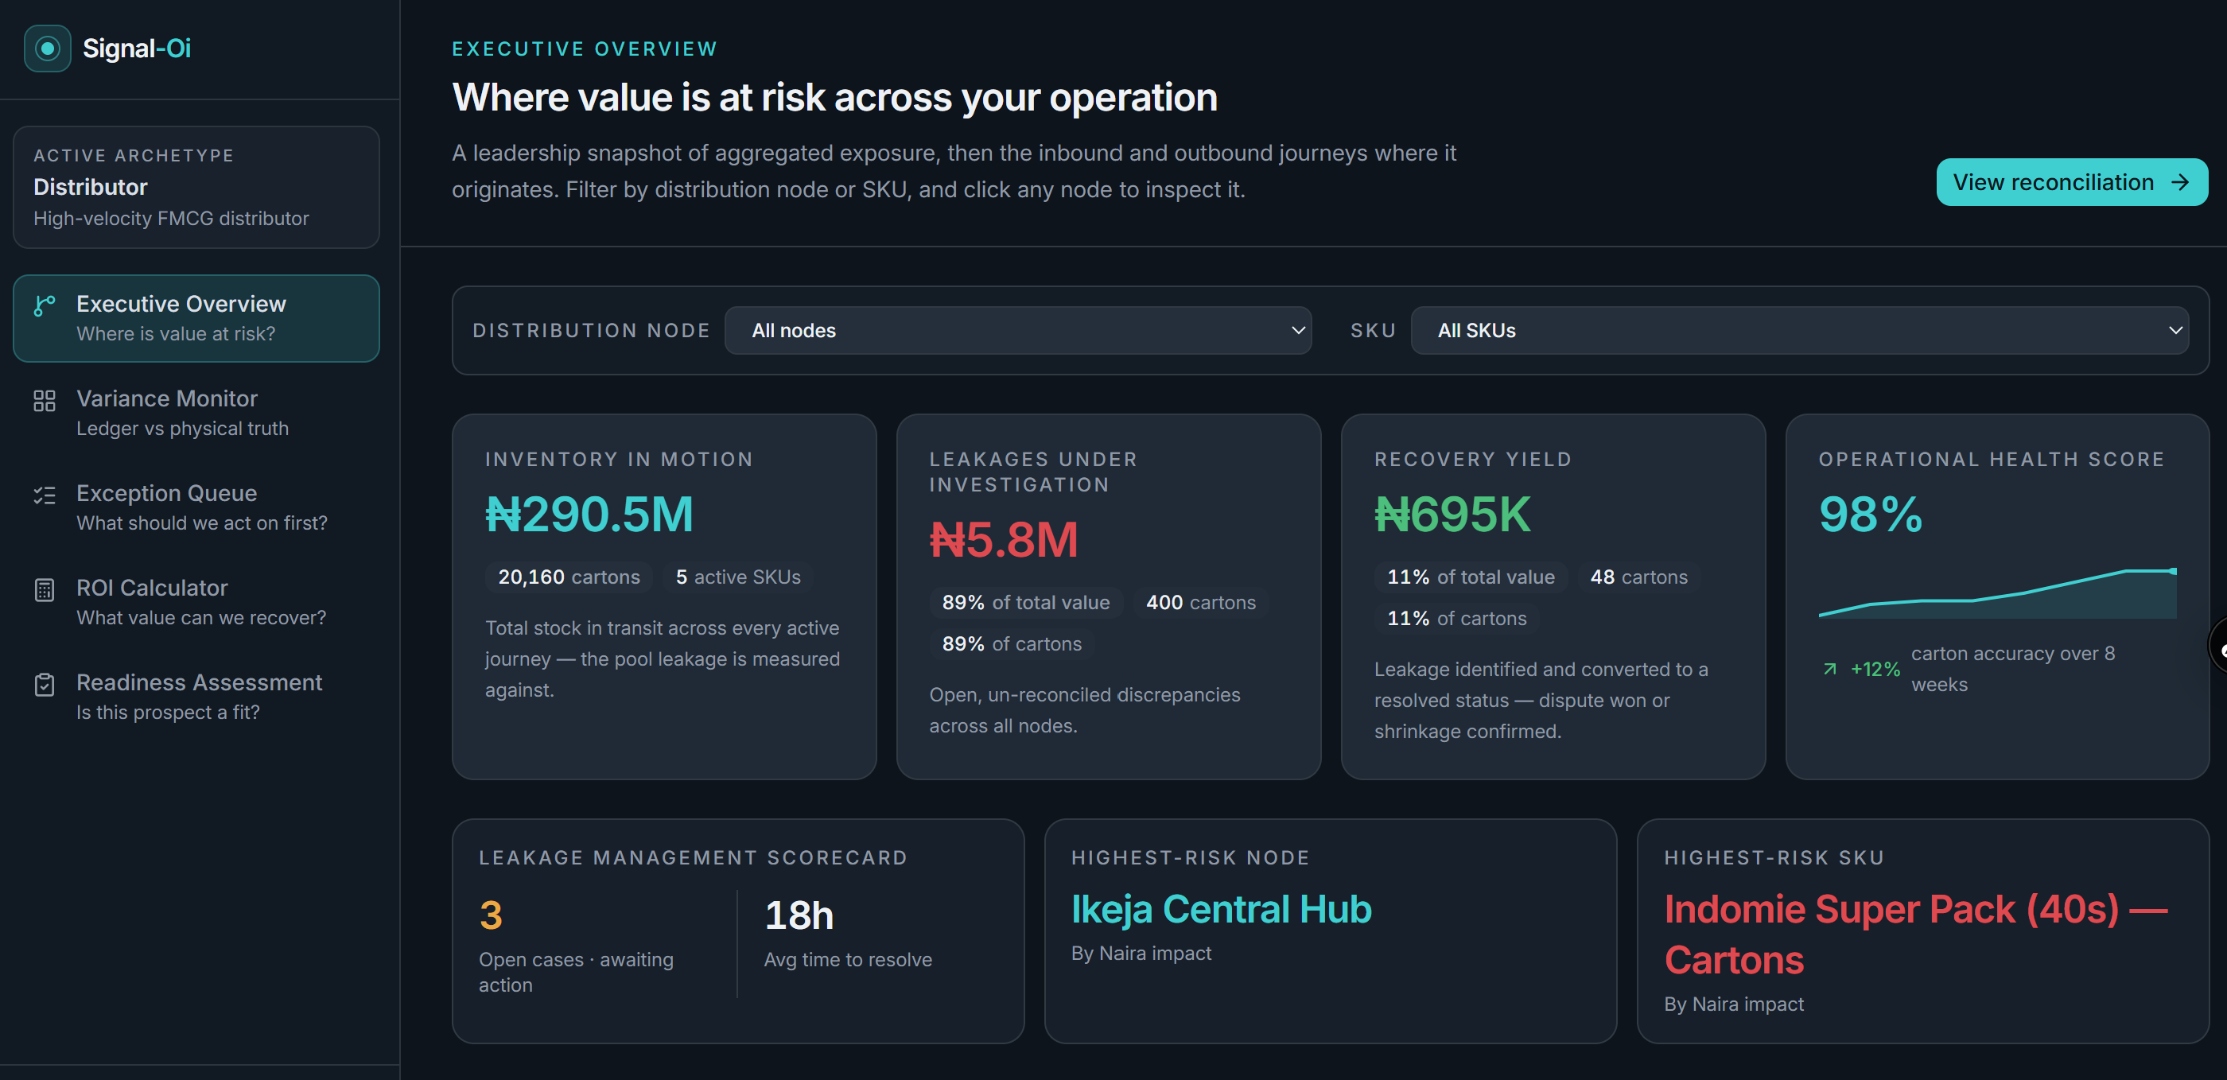
signal-oi-demo.vercel.app
Executive Overview — Inventory in motion, leakage under investigation
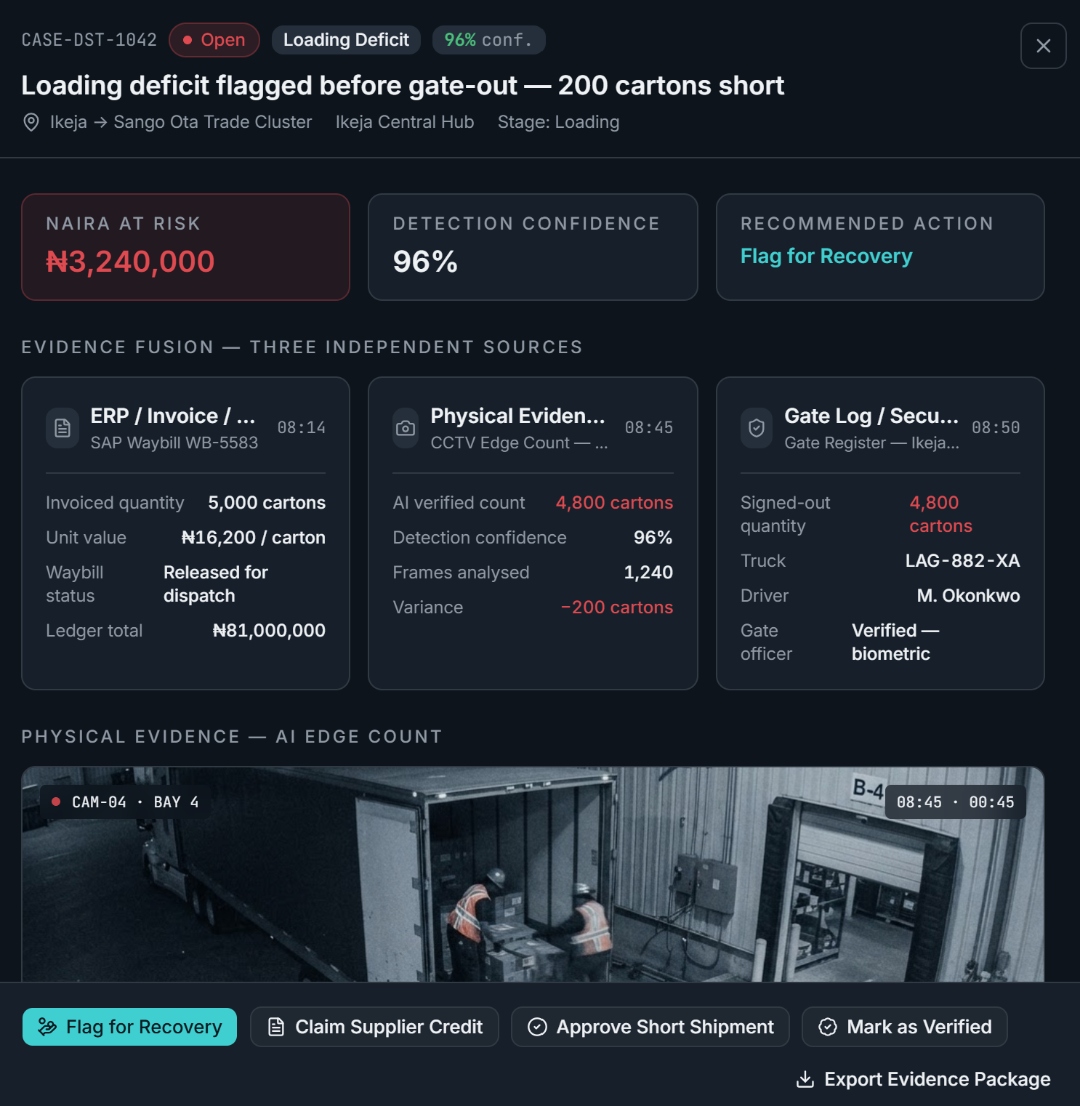
signal-oi-demo.vercel.app › Case CASE-DST-1042
Evidence Case File — ERP, CCTV & Gate Log fused into one verifiable record
Your CCTV timestamp. Your GRN. Your ERP entry. Your gate log. Fused into one verifiable record — surfacing the discrepancy before the truck leaves the yard.
The operational-intelligence layer that makes them work together
The Visibility Gap
Visibility ends at the depot gate.
Your ERP records every primary dispatch accurately. Your CRM captures field rep visits and trade agreements. But once goods cross the distributor’s depot gate, visibility effectively ceases.
Secondary sales data arrives two to four weeks late, self-reported on spreadsheets. The five structural failures below are not caused by lack of data — they are caused by the failure to connect what already exists.
01
15–20% of gross revenue at risk
Trade Promotion Leakage
Without real-time outlet-level data, distributors claim rebates for schemes never executed. You pay for market share gains that never materialise.
02
2–4 week secondary sales reporting lag
Inventory Distortion & Stockouts
Production and dispatch planning runs on stale data. Channel stuffing coexists with catastrophic stockouts — marketing spend wasted on empty shelves.
03
80–120 day working capital cycle
Trapped Working Capital
Inventory sitting in distributor warehouses traps cash. Where the local currency is volatile, every extra day of working capital cycle extends FX exposure directly.
04
70% of sales with no digital audit trail
Field Force Opacity
Hundreds of field reps serve informal markets with no structured data capture. Route efficiency and outlet coverage cannot be verified or optimised.
05
$750K–$2.3M annual tech spend — 70% data gap
Enterprise Systems Blind Spot
ERP and CRM systems give near-perfect primary visibility. But both stop at the depot gate — where the majority of your sales actually happen.
Signal-Oi for Manufacturers
See Sell-Through. Control Availability. Verify Execution.
One intelligence layer that sits above your existing ERP and CRM systems — connecting downstream sell-through, distributor inventory positions, and commercial execution signals into a single view your commercial leadership can act on before leakage becomes a month-end surprise.
1
Stockout Prevention
Real-Time Sell-Through Intelligence
See what is actually selling — by SKU, territory, and distributor
Near real-time secondary sell-through data — independent of distributor ERP or CRM. Anomaly detection flags SKU offtake drops before they become permanent revenue loss. Your commercial leadership sees what is moving, and where, days before month-end reports land.
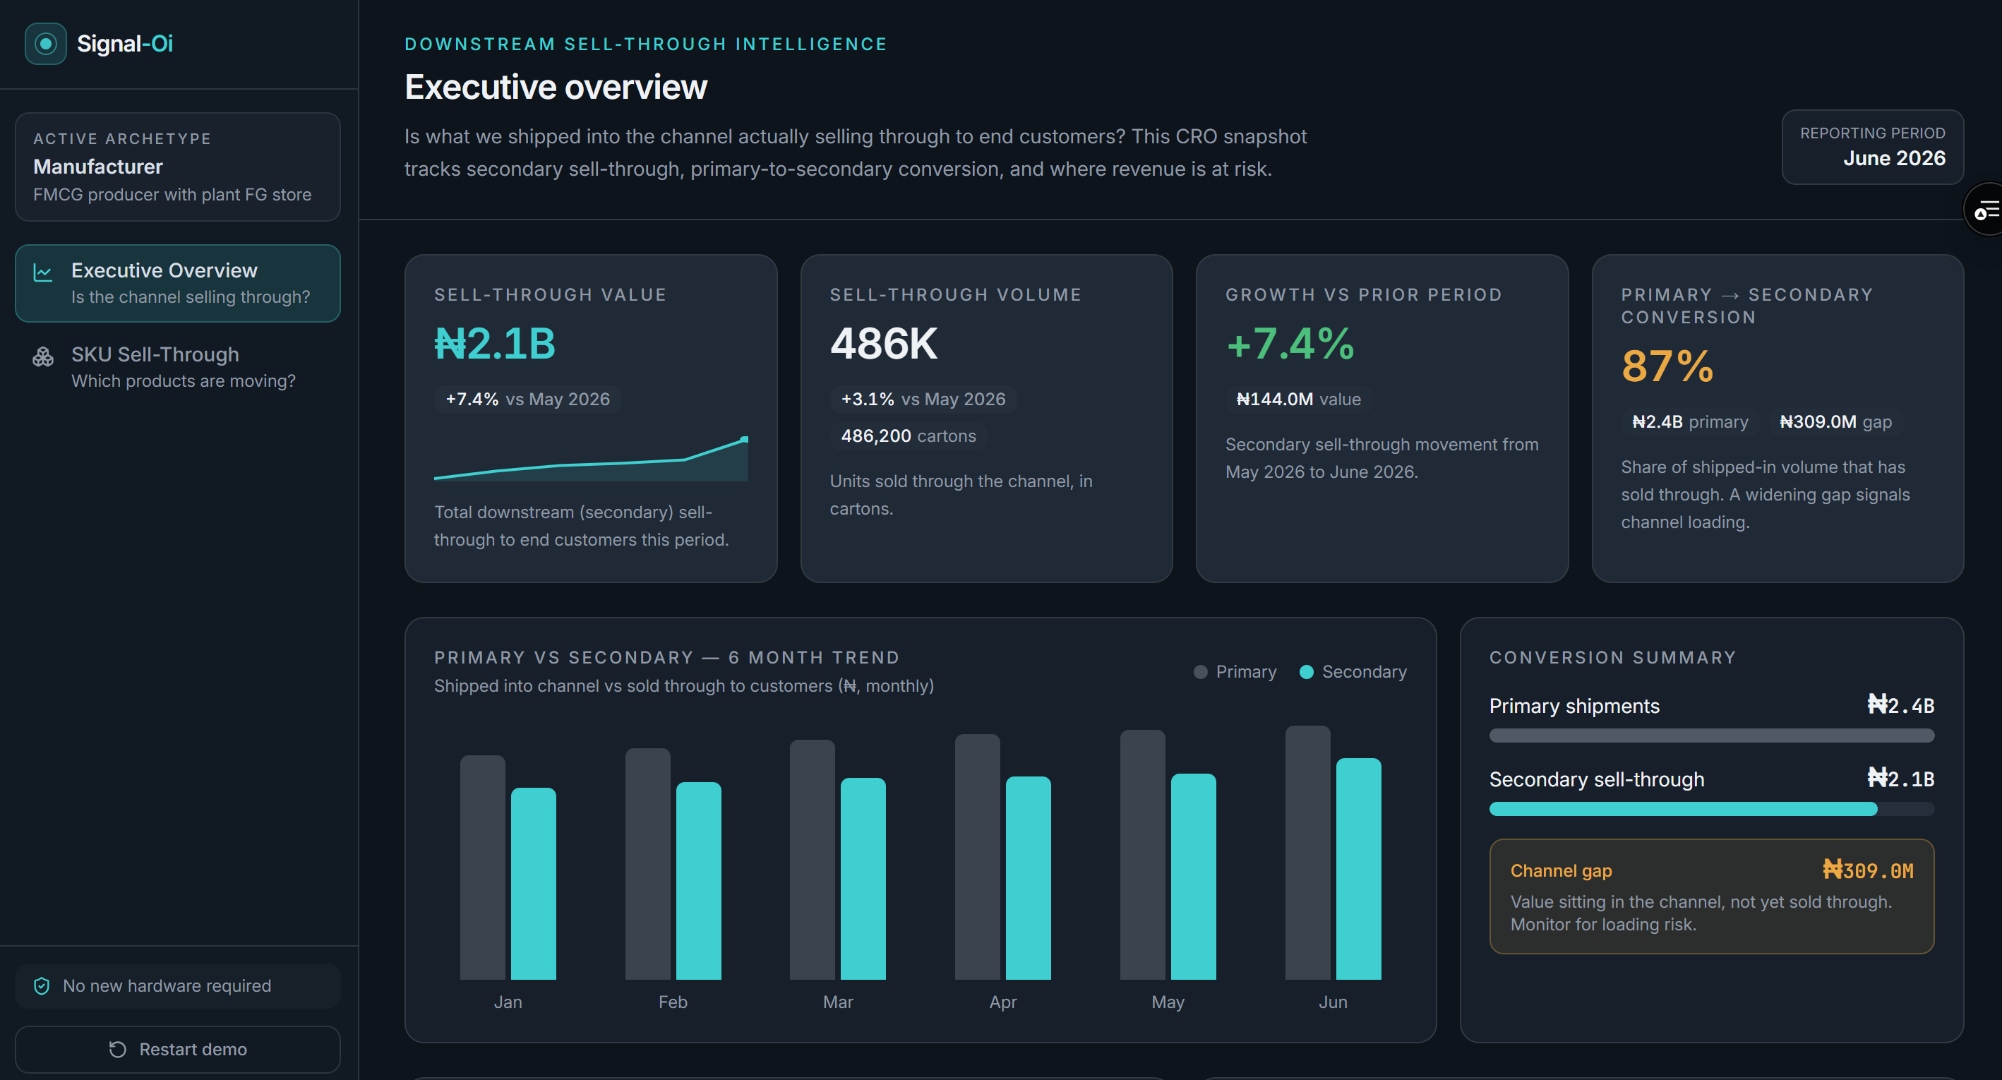
Signal-Oi · Sell-Through Intelligence
Sell-through by SKU, territory, and distributor — in near real time
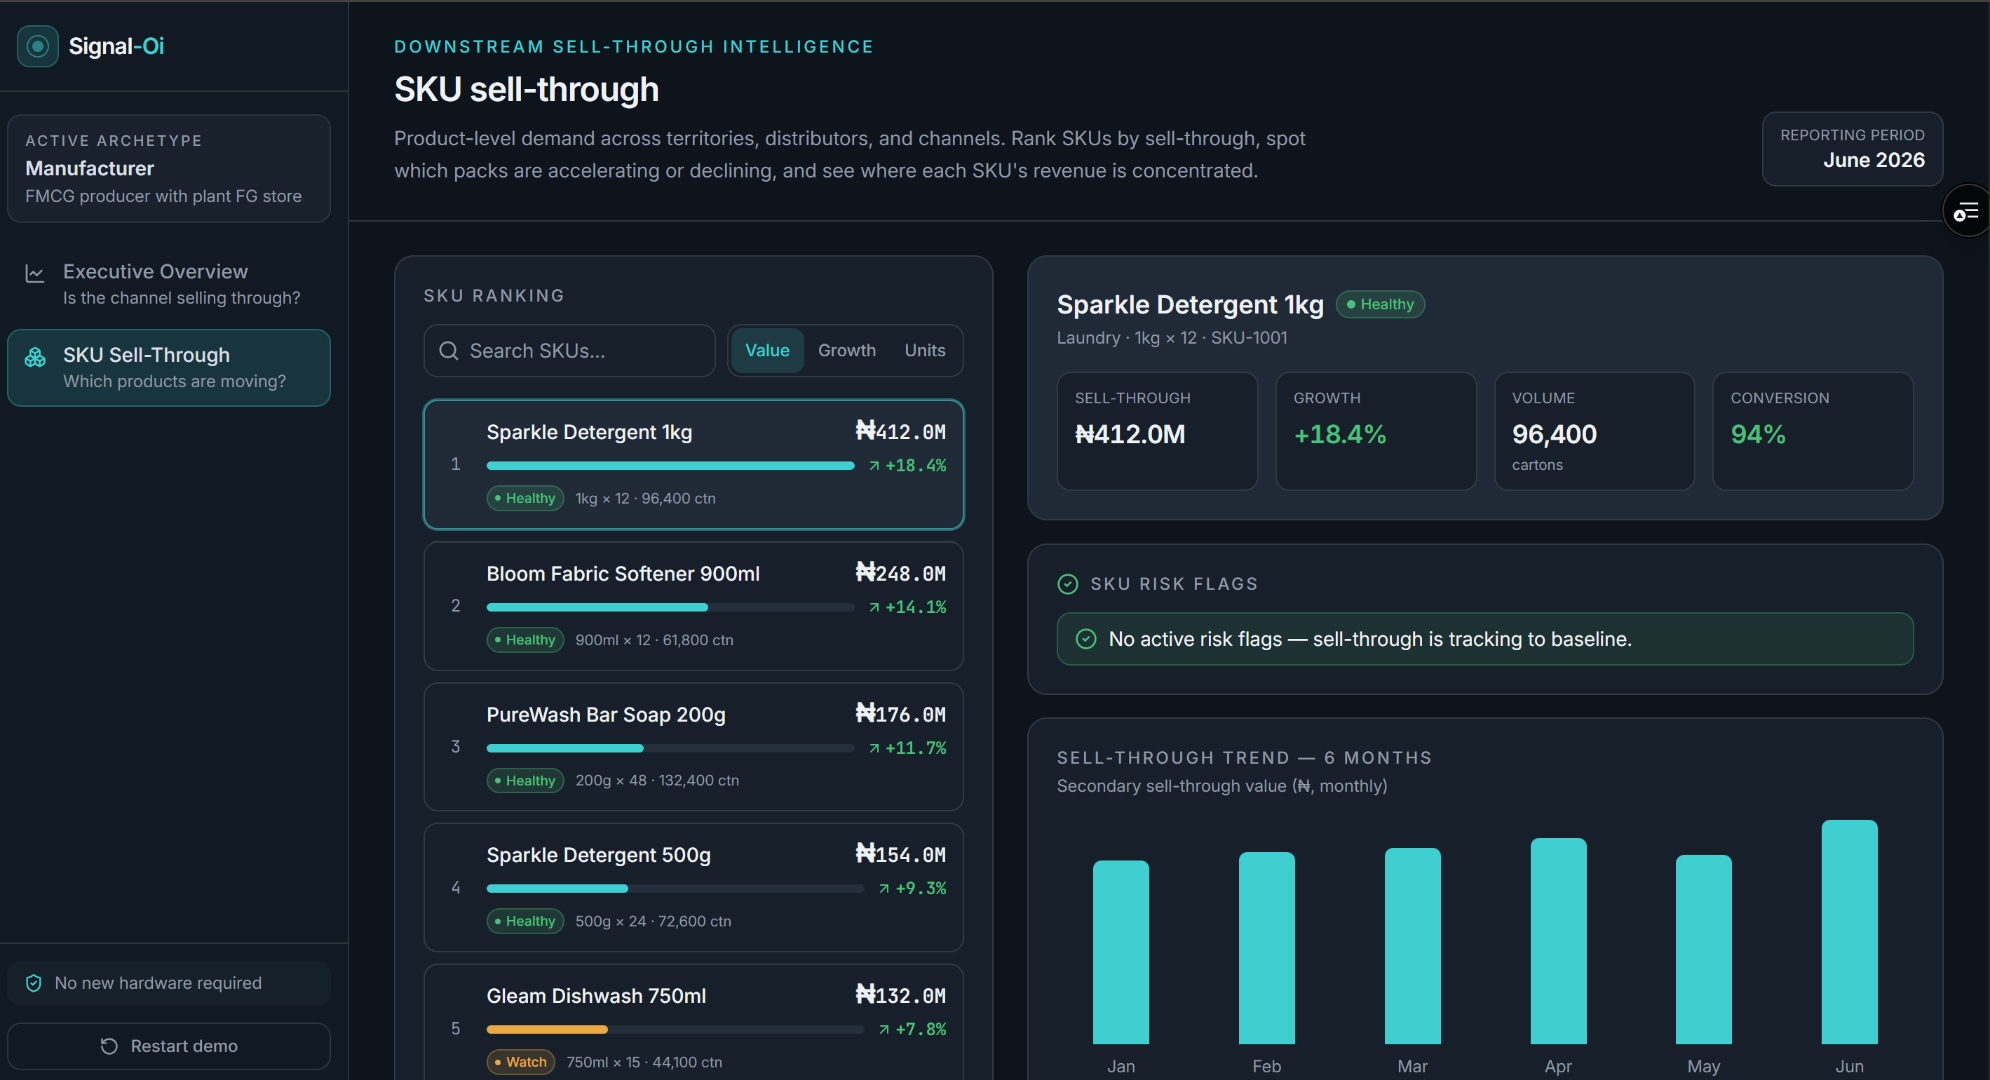
Signal-Oi · Distributor Inventory & Availability
Inventory positions mapped against verified sell-through velocity
→ Demand sensing that prevents stockouts · Marketing ROI protected by real outlet-level visibility
2
Working Capital
Inventory Intelligence & Availability Control
Control where inventory can convert into revenue
Distributor inventory positions mapped against verified sell-through — identifying where stock is trapped, aging, or misallocated. Replenishment quotas set on actual sell-through velocity, not self-reported figures. In volatile-currency markets, every day of misallocated stock extends FX exposure.
Verify that the revenue plan is happening in-market
Verifies whether commercial plans are executing in-market — promotions, rebates, outlet coverage, field visits. Rebates only trigger when secondary sales confirm execution, eliminating distributor over-claiming. The 70% open market becomes a structured, auditable data stream.
→ Trade promotion leakage structurally eliminated · Open market execution verified and auditable
The Landed-Cost Gap
You price the goods before you know what they cost.
A single consignment generates a purchase order, a packing list, a bill of lading, a clearing agent invoice, duty and levy receipts, a transport note, and a warehouse GRN. Each is accurate in isolation. None of them are reconciled against each other.
So the real landed cost per SKU only emerges weeks later, in a finance spreadsheet, long after the selling price was set and the container was released. Shortages get absorbed. Agent charges go unchallenged. Demurrage is discovered on the invoice.
The documents to prevent all of this already exist. They have simply never been connected to each other.
01
2–6 weeks after arrival
Landed Cost Known Too Late
Selling prices are set on estimated cost. By the time duty, clearing, demurrage and transport are consolidated, the stock is already sold — sometimes below true cost.
02
Ordered vs shipped vs received
Quantities Never Reconciled End to End
What was ordered, what was shipped, what cleared, and what was received are recorded in four systems. Short shipments and in-transit losses are absorbed rather than claimed.
03
Line items with no source document
Agent & Clearing Charges Unverifiable
Clearing invoices bundle duty, levies, handling, and discretionary charges. Without the underlying receipts matched line by line, over-billing is indistinguishable from legitimate cost.
04
Billed after the fact
Demurrage Discovered, Not Prevented
Free-time clocks run per container in systems nobody watches daily. The first signal is a charge on an invoice — when the avoidable window has already closed.
05
Margin set before cost is known
FX & Duty Exposure Priced Blind
Payment, clearance, and sale happen at three different exchange rates and duty positions. Without cost locked per shipment, margin reporting reflects assumptions, not reality.
Signal-Oi for Importers
One consignment. One timeline. One true cost.
Signal-Oi sits above the systems and documents you already have — ERP, clearing agent paperwork, shipping line portals, transport notes, and warehouse receipts — and binds them to a single consignment record.
Every charge and every quantity is matched to its source document as it arrives, so variance surfaces during the shipment rather than after the quarter. No new hardware. No change to how your agents work.
1
True SKU Margin
Live Landed-Cost Intelligence
Cost per SKU, not per container
Freight, duty, levies, clearing, handling, finance cost, and inland transport allocated down to SKU level as each document lands — not at month-end close. Pricing decisions are made against real cost while the stock is still unsold.
→ Prices set on verified cost · Loss-making SKUs identified before the next order
2
Shortage Recovery
End-to-End Consignment Reconciliation
Ordered, shipped, cleared, received — matched automatically
PO, packing list, bill of lading, and warehouse GRN reconciled line by line, with discrepancies flagged the moment stock is received. Every shortage arrives with an evidence trail strong enough to support a supplier or insurance claim.
→ Short shipments claimed, not absorbed · In-transit loss patterns made visible by supplier and route
3
Charge Assurance
Clearing, Demurrage & Agent Cost Control
Verify every charge against its source document
Agent invoices matched against official duty receipts and tariff positions, with unsupported line items flagged for challenge. Free-time clocks tracked per container so the demurrage risk window is visible days before the charge exists.
→ Over-billing surfaced before payment · Avoidable demurrage prevented rather than reported
Your packing list. Your bill of lading. Your duty receipt. Your agent invoice. Your warehouse GRN. Fused into one verifiable consignment record — surfacing the variance while the container is still in your control.
The operational-intelligence layer that makes them reconcile
The Design Partner Cohort
5 Seats · Exclusive Cohort
We are selecting five operators to co-design the future of trade and distribution intelligence.
We are looking for Manufacturers, Distributors, and Importers who want to directly shape how Signal-Oi is built — and be the first to pilot it in their operations. You are not testing a finished product. You are helping build it.
Engagement Workflow
A practical, low-risk co-design process starting with a 30-minute conversation. Scroll through the six steps on the right.
Direct Influence on Product Design
Your team’s feedback directly shapes our intelligence layer — ensuring it solves your specific bottlenecks without adding administrative bloat.
A Unified Operational Timeline
We build a test environment reconciling your ledger with what physically happens on the floor — at receiving, storage, and dispatch.
Prioritised Financial Impact List
Mismatches and leakage ranked by monetary value in your own currency, so your team focuses on the most expensive problems first — not operational noise.
Evidence-Backed Case Files
Data linked directly to physical events — turning operational suspicion into fast, recoverable action with a complete audit trail.
Next Steps: Engagement Workflow
1
Initial Discovery Chat
A 30-to-45-minute call with your PoC to validate current pain points, do a quick systems check, and gauge mutual fit. No technical deep-dive — just a genuine conversation.
30–45 mins · Low effort
2
Initial Readiness Assessment
We review a small sample of your existing data to confirm your systems can be connected without requiring new hardware or disruptive integration work.
Data Check · No new hardware
3
Design Partner Letter of Intent
A straightforward LOI that aligns both teams on scope, success metrics, and our mutual commitment to the co-design process.
Formal Alignment · Mutual Commitment
4
Build & Test — Co-Design Phase
We work closely with your team to map your operational reality, generate detailed requirements, and build/test the integration on a narrow scope. Your team shapes the workflow.
Co-Design · Requirements Generation
5
Pilot Rollout
An 8-to-12-week live pilot to track, flag, and recover actual operational losses in real time — with your team’s buy-in on every metric and milestone.
8–12 Weeks · Live Pilot
6
Impact Review & Path Forward
We review the hard value recovered and operational time saved with your leadership, then decide together how to scale across your wider network.
Impact Measurement · Shared Decision
Data Sources
Research & Industry References
The benchmarks cited on this page are drawn from published industry research. Where a figure is specific to a market, we say so — the structural problem is not market-specific, but the numbers that measure it are.
OmniRetail · 2026
The Nigeria FMCG Industry Report 2026
Confirms that Nigerian FMCG distributors operate on razor-thin margins of 2–5%, making cash flow timing — not revenue — the critical operational variable.
NielsenIQ · 2024
State of the Nation: FMCG in Nigeria
Documents that traditional trade channels account for 98% of the retail landscape, confirming the structural dominance of fragmented wholesale distribution networks.
Omniful · 2026
Inventory Shrinkage in MENA
Establishes that unautomated distribution hubs record shrinkage rates exceeding 4–5%, with administrative errors accounting for 21–25.7% of all discrepancies.
Next Step
Ready to see if your signals can be connected?
We would like to schedule an initial discovery chat with your PoC in the next two weeks. This is a 30-to-45-minute conversation — not a product pitch.